Test Execution
This page describes everything around running and inspecting test executions — both the list view at /tenant/:tenant/executions and the detail view at /tenant/:tenant/executions/display/:executionId/test/:testId. Specific topics (cache, auto-waiting, scrolling, tab handling, …) have their own sub-pages.
The Executions list
Open Test Executions in the left navigation. The list shows every execution the tenant has accumulated, newest first.
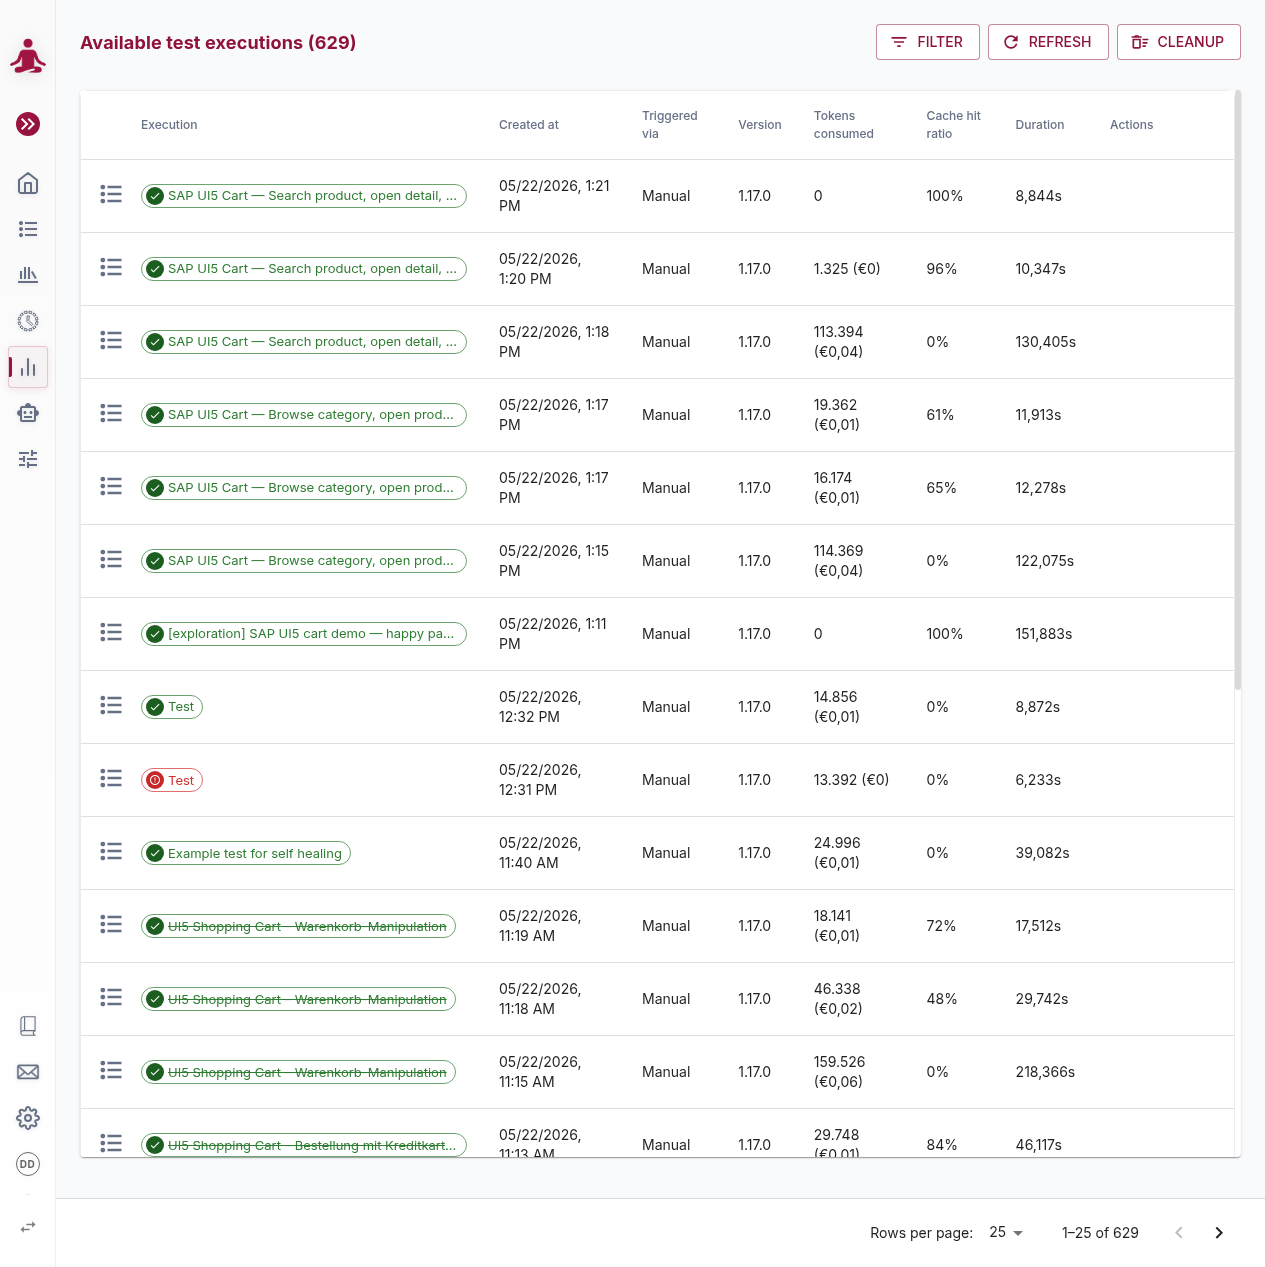
The header shows the total number of executions (Available test executions (629)). The page is server-paginated — choose 5, 10, 25, 50 or 150 rows per page at the bottom of the table.
Columns
| Column | Meaning |
|---|---|
| (type icon) | Icon indicating whether the run came from a single Test Case or an Execution Plan (see Execution Plans). |
| Execution | The execution plan name (or "Unnamed" for stand-alone runs), rendered as a coloured status tag. The tooltip lists overall status plus the first ten member tests for plan runs. A struck-through name means the test or execution plan has been deleted. |
| Created At | When the execution was created, in your local time zone. |
| Triggered via | How it was started: Manual, Scheduled, Pipeline, or Admin. |
| Version | The msg.ZenTestAI runner version that executed the test. |
| Tokens consumed | Total AI tokens used. If pricing is configured for the model, the cost in your currency is appended in parentheses (e.g. 1.325 (€0)). See AI-Models for how to set pricing. |
| Cache hit ratio | Percentage of tokens that were served from the cache rather than re-asked to the model. Higher is cheaper and faster. |
| Duration | Wall-clock execution time. |
| Actions | Hover-revealed buttons — see below. |
Row actions
Hover a row to reveal:
- Rerun — re-execute the full run. Only available for terminal statuses (Passed / Failed / Cancelled / Failed-Blocked) where the underlying test or execution plan still exists.
- Rerun failed — only for execution plan executions that contain at least one failed, cancelled or never-started test. Reruns just those tests, leaving passing ones alone.
- Delete — permanently delete the execution and its artefacts (screenshots, video, logs). Asks for confirmation.
Clicking anywhere else on the row opens the detail view.
Sorting and filtering
Filtering and sorting live in the table header, not in a toolbar:
- Per-column controls. Hover a column header to reveal its controls: Created At offers a tri-state sort (ascending → descending → back to the natural, newest-first order) and a date-range filter; Execution and Triggered via offer value-checklist filters with a search field. Several column filters combine with AND. The shared behaviour of these controls is described on List sorting & filtering.
- Additional filters. The always-visible button in front of the Execution column name (sliders icon, with a badge showing the number of active criteria) opens a popover with the list-wide filters: Status, Test Case, Execution Plan, and Time Range (Today, Last 7 days, Last 30 days, …, All). Apply runs the filters; Reset clears them. Unlike the per-column filters, these change what the server sends.
- Reloading. There is no Refresh button; the list reloads from the backend when you change the page or the rows-per-page setting.
Because the page is server-paginated, per-column sorting and filtering apply to the rows loaded on the current page; the additional filters narrow the whole list.
Execution status values
The platform tracks seven statuses:
| Status | Meaning |
|---|---|
| Initial | Newly created, not yet picked up by a runner. |
| Queued | Waiting in line because another execution is currently running and the tenant's parallel-execution limit is reached. |
| Running | Currently executing. |
| Passed | Finished successfully. |
| Failed | Finished with at least one failing step. |
| Cancelled | Stopped by the user before completion. |
| Failed (Blocked) | Could not run because a parallel execution policy prevented it (typically: another execution on the same target was still running). |
Each status is rendered as a coloured tag on the Execution column.
The Execution Details view
Click any row in the list (or open the URL /tenant/:tenant/executions/display/:executionId/test/:testId) to land on the per-execution detail page. This is the screen you spend most of your time on when investigating a run.
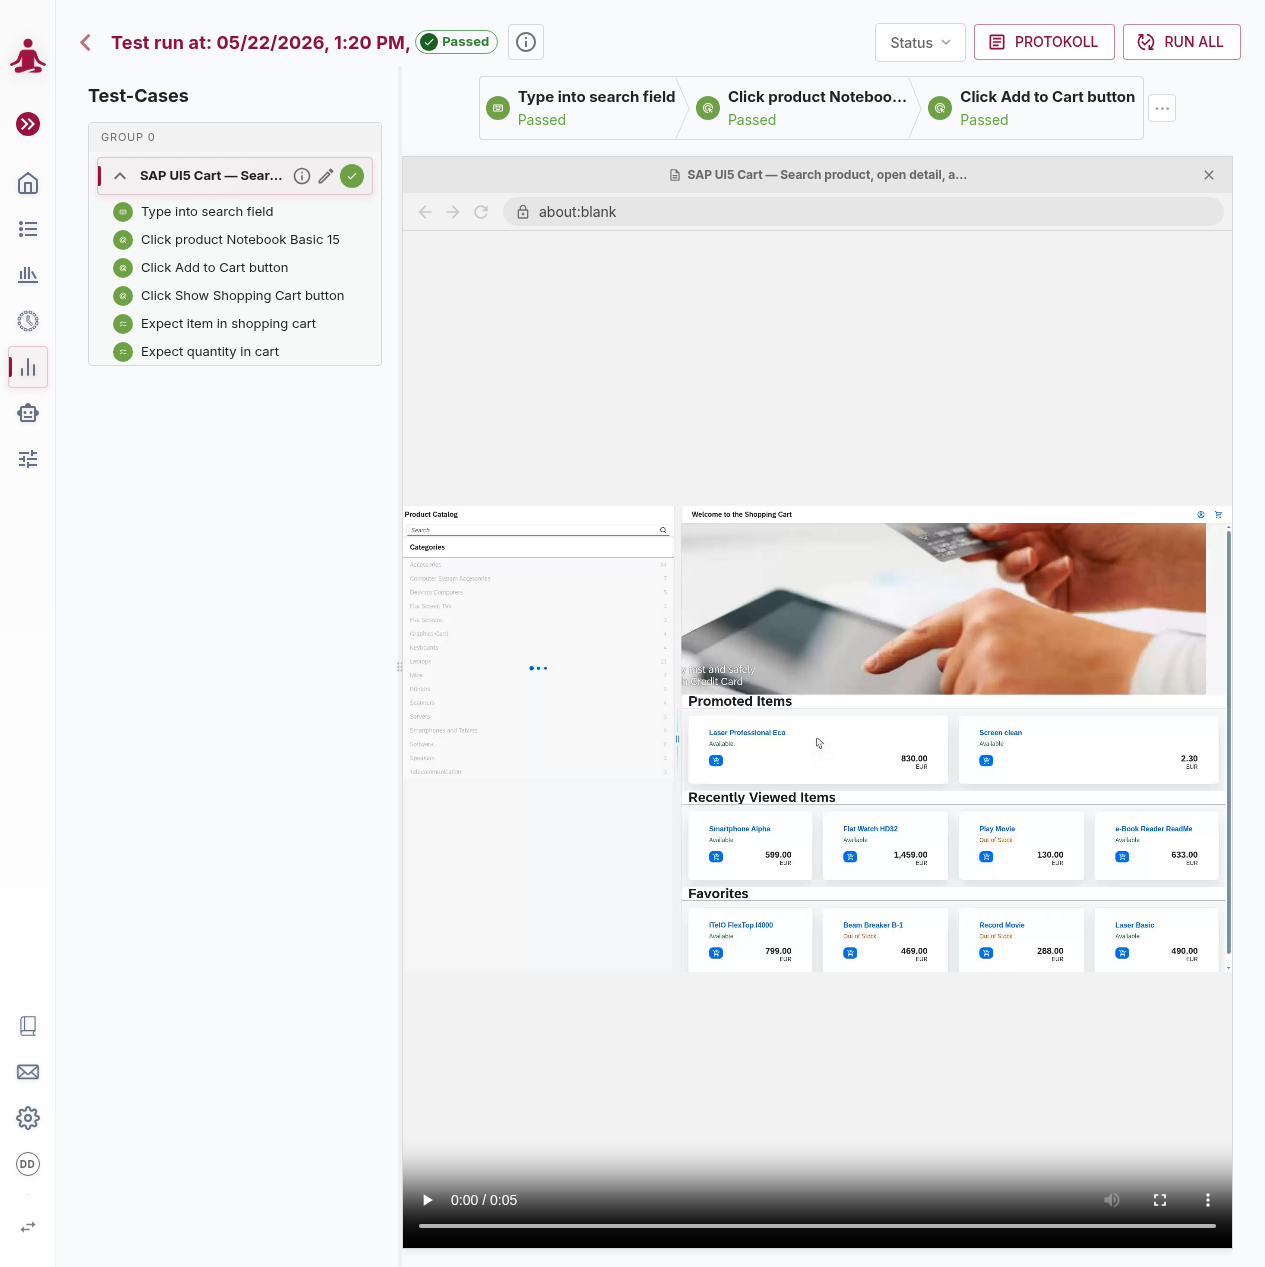
The page has three regions:
- Header with the run title, the execution status, and all per-execution actions.
- Left panel listing all test cases included in this execution.
- Right panel with the step timeline at the top and a browser-frame preview (video for finished runs, live screenshot for running runs) at the bottom.
The divider between left and right is draggable; the width is remembered across visits.
Header / toolbar
Left to right:
- Back arrow — returns to the Executions list.
- Title — for a single test:
Test run at: <date> <status>. For an execution plan run:Test run of <Plan name> <status>where the plan name links to the plan definition. Archived executions show a grey "Archived" label; interactive runs show a pulsing "Interactive" badge. - Info button (ⓘ) — opens a popover with start/end time, trigger source, execution plan name, runner version, test count, total tokens + cost, duration. For tests imported from an external system (Jira XRay, Zephyr), the popover also shows an Open in External System link that opens the bound issue.
- Display Mode selector — toggles what each step card shows next to its status: Status (the default), Token Info (uncached / total token count), or Duration.
- Rerun — re-execute the run from scratch. Visible only for terminal executions where the underlying test still exists. Shortcut: Ctrl+p.
- Rerun failed — for execution-plan executions with at least one failed / cancelled / initial test, reruns just those.
- Cancel — visible while Running / Queued / Initial. Stops the execution after a confirmation.
- Pause to Interactive — for a single-test run that is still running, hands control over to interactive mode so you can step through the rest manually (see Interactive execution below).
- Stop Recording — visible during an interactive run when a step is processed.
- Log — opens the Log / Protocol popover for the selected test case. Visible only when a test is selected in the left panel.
Left panel — Test-Cases
Each test case included in this execution appears as a row in the left panel.
- The row header shows the test title (with
(combination name)appended if it was run with a variant), a status icon (animated during a run), an ⓘ info button, and an edit pencil that jumps to the test case. - The ⓘ info popover for a test shows description, the parameter combination used, duration, the AI's result message, a timeline of resolved parameters and macro calculations, a Clear Cache button for the whole test, and — for passed/failed runs — a Timing analysis chart icon that opens a per-step breakdown of network requests and wait conditions.
- Execution plan runs group tests by execution order (Setup → main tests → Teardown), with labelled dividers between groups.
- Expanding a test reveals its steps — and, when the test defines activities or contains Loop steps, those are shown as collapsible nested groups colour-coded by the worst step status inside.
- During a live run the panel auto-selects the first running test, unless you have manually picked another one.
There is no search or filter inside the panel — for many tests, scroll through groups or use the URL's testId segment to jump straight to one.
Right panel — step timeline
The top half of the right panel is the step timeline for the selected test case. It has two display modes:
- One-liner (default) — a single horizontal row of step cards, centred on the most relevant step (the one playing in the video, the running step, the last finished step). When more steps exist than fit the width, a
…indicator appears at each end; clicking it switches to the all-steps view. - All steps — a wrapped, multi-row list of every step card. A collapse icon returns to one-liner mode.
Each step card carries:
- A coloured status icon (animated arc while in progress).
- The step title.
- A secondary line controlled by the Display Mode selector — status text, cache info (Cached / Partly from cache / Not cached), or duration.
- A warning indicator when the AI detected potential issues (multi-match elements, DOM instability, cache mismatches). Clicking the warning opens the step popover on its Warnings tab.
Loop and Condition steps appear as a single card here; expand them in the left panel to see iterations / branches.
While a video is loaded, hovering a step card seeks the video to that step's start time.
Step detail popover
Clicking a step card (in the timeline or the left panel) opens a popover with up to three tabs.
General
| Field | Description |
|---|---|
| Description | The step text as written. |
| Resolved parameters & calculations | The same text after substituting [[parameters]], ${=macros()} and ${ dynamic calculations }. |
| Value | Supplementary value (e.g. the text typed, the value selected). |
| Search for element | The element description the agent used to find the target. |
| Result | The AI's verdict (passed / failed) with the verbose explanation. |
| Explanation for result | The AI's confidence reasoning. |
| Suggestion for better description | An AI-generated improvement suggestion for ambiguous steps, with a Take over suggestion button. |
| XPath for element | The XPath actually used to locate the element. |
| Token cache info | Cache status with a deep-dive ⓘ dialog. The dialog shows the cache entry, XPath candidates with quality ratings, semantic validation results, statistics, and lets you delete individual cache entries. |
| AI model | The model that executed this step. |
| Duration | Time in seconds (for finished steps). |
| Screenshots | All screenshots taken for the step, clickable to open a full-screen lightbox. |
Additional — appears for some step types:
- Expect / Condition / Condition Group — the exact question the AI evaluated, plus any clarification Q&A.
- Select from combobox / agentic execution — a step-by-step history of the agentic loop: action, goal, reasoning, strategy, element, value, result, error.
- Loop — a loop-analysis card (static vs. dynamic path, "upgraded via screenshot" badge) plus per-iteration cards with the continue / stop / skip decision and parameter substitutions for each iteration.
Warnings — appears when the agent flagged the step. Shows structured warning cards with remediation hints and a thumbs-up/down feedback widget on element selection.
Footer buttons on the popover:
- Fix known error (light-bulb) — appears when the step matches a known error pattern; opens the known-error dialog.
- Get step recommendation (wrench, red) — interactive mode only, while paused; asks the AI for suggestions on what to do next.
- Start recording from here — on a finished run, starts a new interactive execution that fast-forwards to this step.
- Clear cache — clears the AI cache for this single step. Useful when a step keeps picking the wrong element because of a stale cache entry.
Browser frame
The bottom half of the right panel is a simulated browser window containing either a video (for finished, non-interactive runs) or a live screenshot (for running or interactive runs).
- Tab strip — open browser tabs with their titles. Clickable in interactive unlocked mode.
- URL bar — current page URL. Editable in interactive unlocked mode (Enter navigates, Esc cancels).
- Back / Forward / Reload — active in interactive unlocked mode.
- Lock / Unlock toggle — interactive mode only. Locked means the runner controls the browser; unlocked lets you click and type freely on the page (the runner doesn't record those interactions).
- Red window-close button — visible during a running execution. Cancels the run (with confirmation).
- Dev Console — visible while a run is in progress. Opens the Developer Console in a separate window.
For finished runs the video controls at the bottom are the native HTML5 controls (play / pause / seek / speed / fullscreen). The URL bar updates as the video plays.
While a test is queued or waiting (initial, position-in-queue, waiting for preceding tests, analysing steps, starting up), the browser area shows an informational overlay instead of a screenshot.
Log / Protocol
The header's Log button opens a per-execution log popover with a two-tab layout (Test / Execution) and tools to filter, export and trigger verbose support reruns. See Reading the Log for the full walk-through.
Cache management
The XPath / element cache speeds up repeated executions by reusing element lookups that have already been validated by the AI. Three levels of cache clearing are available:
- Per step — Clear cache button in the step detail popover footer.
- Per test — Clear cache button in the test's ⓘ info popover in the left panel.
- Per cache entry — the detailed cache-info dialog (
ⓘnext to "Token cache info" in the step detail) lets you delete individual XPath candidates if just one is stale.
There is no tenant-wide "wipe the entire cache" action; clear at the level of the smallest unit that is misbehaving. See Caching for the full caching strategy.
Re-running an execution
There are four different ways to re-execute (or partially re-execute) a finished run. They appear as conditional buttons in the toolbar:
| Action | Where | What it does |
|---|---|---|
| Rerun | Toolbar of any terminal execution; same button in the row of the list page. Hotkey: Ctrl+p. | Re-executes the full run with the same test case and the same parameter combination(s). |
| Rerun failed | Toolbar of any execution-plan execution that has at least one Failed / Cancelled / Initial test. | Re-runs only the failed members of the plan, keeping the already-passed test results intact in the new execution. |
| Collect Support Information | Toolbar of the Log popover. | Re-runs the test in verbose mode, capturing extra data (AI communication, HTTP, HTML snapshots, memory) for support. |
| Start recording from here | Step popover on a finished run (non-login steps only). | Starts a new interactive execution that fast-forwards to the chosen step so you can change the test from that point on. See Recording. |
Re-running always creates a new execution — the previous one is left untouched and remains in the list. If the test case has changed since the original run, the new run uses the current version.
Interactive execution
When an execution is running, you can take over manually with Pause to interactive in the toolbar (single-test runs only). The detail page then switches into the same recording UI that the Record Test button on the test case uses — the left panel becomes a step recording panel, the browser frame gains a Lock / Unlock toggle, and you can add, edit or finish steps live.
The full guide to this workflow lives on the Recording page. Specifically:
- Locking, unlocking and the action menu — see Recording → The lock toggle.
- Driving playback from a paused position — see Recording → Driving the playback.
- Recommendation mode (alternative step descriptions for an element) — see Recording → Recommendation mode.
- Starting an interactive session from a finished run — see Recording → Starting a recording.
Developer Console
The Developer Console is a pop-out window available while an execution is running. It exposes an AI-driven element finder, a live DOM inspector, and a JavaScript console — and there is a Timing analysis dialog with the network-request timeline for finished runs. See Developer Console & Network Inspection for details.
Auto-refresh, deep links and permissions
- Auto-refresh. The detail view streams updates over Server-Sent Events while the execution is not in a terminal state, with a 10-second polling fallback if SSE drops out. The list view does not auto-refresh — it reloads when you change the page or the rows-per-page setting.
- Deep links. The URL
/tenant/:tenant/executions/display/:executionId/test/:testIdreliably survives reload and can be shared. URLs withouttestIdredirect to the first test of the execution. - Hotkey. Ctrl+p reruns a terminal execution.
- Permissions. All actions on the executions pages are available to any authenticated user of the tenant. The only gated feature is Collect / Download Support Information, which depends on the tenant's Detailed Service Request policy (configured in Tenant Settings).
Support and bug reports
If a test misbehaves and you can't figure out why, the recommended workflow is:
- Open the failing execution's detail page.
- Open the Log popover.
- Click Collect Support Information, pick which data to include, and confirm.
- After the verbose rerun finishes, click Download Support Information — a dialog lists the collected data and offers the download (per test case for execution-plan runs).
- Share the bundle with the support team.
The bundle contains the test case, the AI model configuration, screenshots, AI communication, and (if you chose) HTTP communication, HTML snapshots and memory snapshots. See Getting Help for the end-to-end support workflow, including what is and isn't included in the bundle and how secret data is handled.
Related pages
- Reading the Log — the per-execution log popover, filters, export and verbose-rerun flow.
- Failed-execution triage — workflow for understanding and fixing a failed run.
- Variants & combinations in executions — how parameterized tests show up in the detail view.
- Developer Console & Network Inspection — DOM inspector, AI element finder, JS console and Timing analysis.
- Execution queue & concurrency — the seven status values, parallel-execution policy and queue overlays.
- Caching, Auto-waiting, Scrolling, Handling of Tabs, Actionability, Recommendations — runner-side topics that influence how a test executes.